Introduction
JANet Description
JANet (Jmol AgeFactDB Network-viewer) is a specialized Jmol-based 3D network viewer for the visualization of ageing-related network data from AgeFactDB.
Selected Features
- Interactive 3D network visualization(rotate, zoom, etc.)
- 2D representation
- Stereo representation(e.g.: side by side, red/cyan)
- 3D beamer mode (condensed side by side stereo, converted for shutter glasses)
- Ageing-related network data (AgeFactDB)
- Lifespan observations
- Ageing factors
- Augmentation nodes(e.g.: allele types, citations)
- Augmentation with external domain knowledge
- Gene Ontology (GO)
- KEGG Pathways
- Genes of interest analysis(e.g.: differentially expressed genes)
- Scripting language
- Jmol scripting language
- JANet-specific API
Requirements
- 8 GB main memory
- Web browser with activated Javascript
Recommended:
- 16 GB main memory
- 64-bit Java system
- Web browser which runs 64-bit Java applets(e.g.: Safari, Internet Explorer, Waterfox)
Availability
JANet is available at the web address http://sysbio.uni-ulm.de/?Software:JANet.
It can be started directly from this server or downloaded for local installation, including all necessary network data.
It can also be downloaded from the GitHub repository JANet at https://github.com/molwizard/JANet.
Installation
The viewer can be started directly from the server at http://sysbio.uni-ulm.de/software/janet or downloaded including all necessary network data for local installation (http://sysbio.uni-ulm.de/software/janet/janet.zip).
For a local installation there are two options:
- Extract the archive somewhere in the file system.
- Install a web server locally and extract the archive somewhere below the server root directory.
Option 1: JANet can be started by opening the fileindex.html from the top level directory
in a web browser as a local file.
In some browsers, like Safari, this requires to switch off a default restriction for local file usage.
The Javascript version of JANet will not work in browsers that prevent loading local binary files using Javascript, like Safari and Opera.
Option 2: JANet can be started by adding the relative directory path of the top-level viewer directory to the server namelocalhost for the local web server and open the web address in a web browser. (Example: http://localhost/tools/janet)
Jmol/JSmol
JANet is based on the molecular viewer Jmol, written in Java, and it's Javascript variant JSmol.
Jmol
Jmol is a popular open source molecular viewer in the field of 3D chemical and biomolecular structures.
Chemical structures consisting of atoms and bonds resemble very well network data with nodes and edges. Therefore many functions for visualizing network data are available also in Jmol. These include basic options like rendering nodes and edges in different colors and sizes, attaching labels, counting edges per node, and identifying not connected subnetworks. In addition, there are also more advanced options like a very sophisticated node selection system. And finally there is available a JavaScript-like scripting language that enables the extension of Jmol by user-defined functions and even the replacement of built-in functions.
Jmol is mainly used as a Java applet in a web browser. But there exists also a standalone Java version suitable for batch processing. The browser integration offers the flexibility to build a customized user interface, extending the built-in user interface.
JSmol
JSmol is a Javascript/HTML5 version of Jmol that is compiled automatically from the Jmol Java code to JavaScript, using an adapted version of the Java2Script Eclipse plugin.
The advantage is that it works on platforms(e.g.: iPhone, iPad, Android) and in browsers(e.g.: Chrome, Firefox) that don't support Java or Java applets.
It offers almost all features of the Java version, but in comparison it is about 5 times(e.g.: rotation, zoom, running built-in commands) up to about 30 times(e.g.: network layout generation) slower.
AgeFactDB
Description
AgeFactDB (http://agefactdb.jenage.de) is a database aimed at the collection and integration of ageing phenotype data including lifespan information.
Ageing factors are considered to be genes, chemical compounds or other factors such as dietary restriction, whose action results in a changed lifespan or another ageing phenotype.
Any information related to the effects of ageing factors is called an observation and is presented on observation pages. To provide concise access to the complete information for a particular ageing factor, corresponding observations are also summarized on ageing factor pages.
In a first step, ageing-related data were primarily taken from existing databases such as the Ageing Gene Database--GenAge, the Lifespan Observations Database and the Dietary Restriction Gene Database--GenDR. In addition, it was started to include new ageing-related information.
Based on homology data taken from the HomoloGene Database, AgeFactDB also provides observation and ageing factor pages of genes that are homologous to known ageing-related genes. These homologues are considered as candidate or putative ageing-related genes.
Ageing Factors
Currently there are implemented three types of ageing factors: Gene, Chemical Compound, and Other Ageing Factor.
Gene
If available, the NCBI Gene ID is used for the identification of genes, to avoid duplicate entries with different names.
If it is not provided, it is tried to assign it automatically using the synonym database GPSDB and the NCBI Gene database. If multiple NCBI Gene IDs might match, no NCBI Gene ID is assigned and only gene symbol and species are used for the integration
Internally always gene symbol, species, and NCBI Gene ID are used to identify a gene. Depending on the information provided by the data source, GPSDB, and NCBI Gene it is possible that the same gene symbol/species combination is included multiple times into AgeFactDB, with and without one or more different NCBI Gene IDs.
Chemical Compound
Chemical compounds are currently identified by the name who was used in the AgeFactDB source databases. No synonym information is used yet within AgeFactDB.
Other Factor
Other factors are for example dietary restriction and heat shock.
Similar to chemical compounds they are currently only identified by their name. Because it is difficult to judge the slight differences that might be involved for example between 'dietary restriction' and 'caloric restriction', it wasn't done any unification yet.
Putative Ageing Factors
In addition to genes with experimental ageing relevance evidence, AgeFactDB includes also genes homologous to these genes as putative ageing factors. They are identified by a homology analysis based on the HomoloGene database from the NCBI.
In contrast to other ageing-related databases, where homologous genes are just named inside a gene page, they are included in the same way as the genes with experimental ageing relevance evidence. This way the full features are also available for the putative ageing factors.
Ageing factors are discriminated from putative ageing factors inside the AgeFactDB web interface by a color coding system shown in the Figure below. Green indicates experimental evidence with an effect on ageing, red indicates experimental evidence with no effect on ageing, and blue indicates computational ageing relevance evidence. The color of all observations assigned to an ageing factor determine the color of the ageing factor, with the following priority: green, red, blue. In addition to the major color, all other assigned colors are also indicated as small squares.
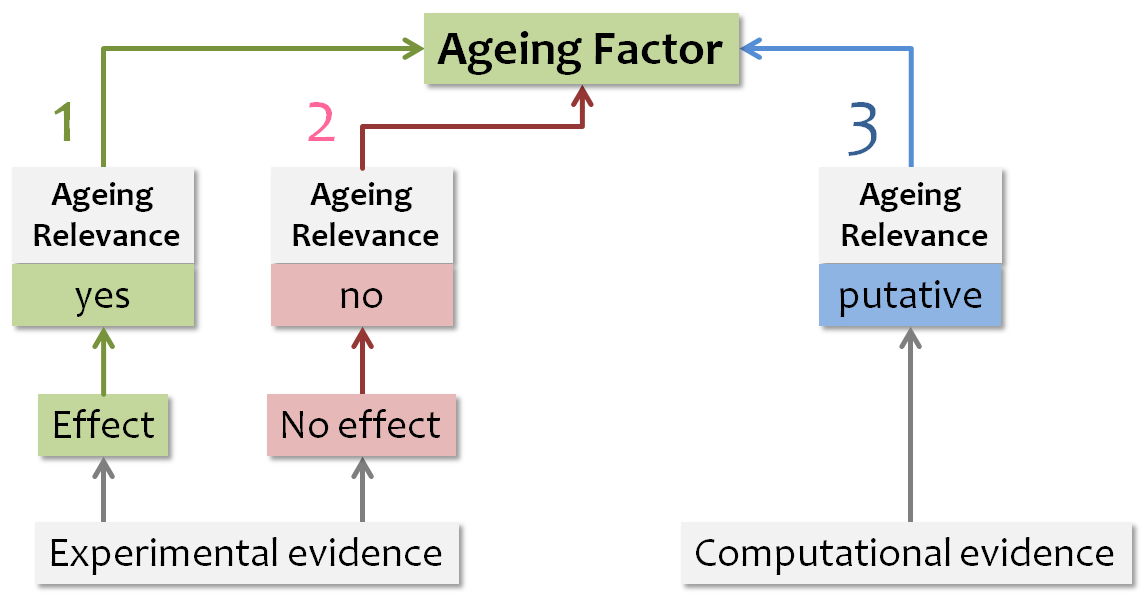
The priority for assigning a color to the ageing factor is indicated by the number:
- Highest priority – 1
- Lowest priority – 3
Observations
Currently there are implemented three types of observations:
- Ageing Phenotype Data Type 1
- Ageing Phenotype Data Type 2
- Homology Analysis
The names are the 'official' names used in the web interface. Initially, the first two types were named 'phenotype' and 'lifespan'. But this didn't really fit, because lifespan is also a phenotype and because some phenotype observations also contained lifespan data. So it was switched to a technical distinction:
- Data Type 1 - free-text ageing phenotype observations
- Data Type 2 - structured ageing phenotype observations
- Homology analysis - structured computational observations.
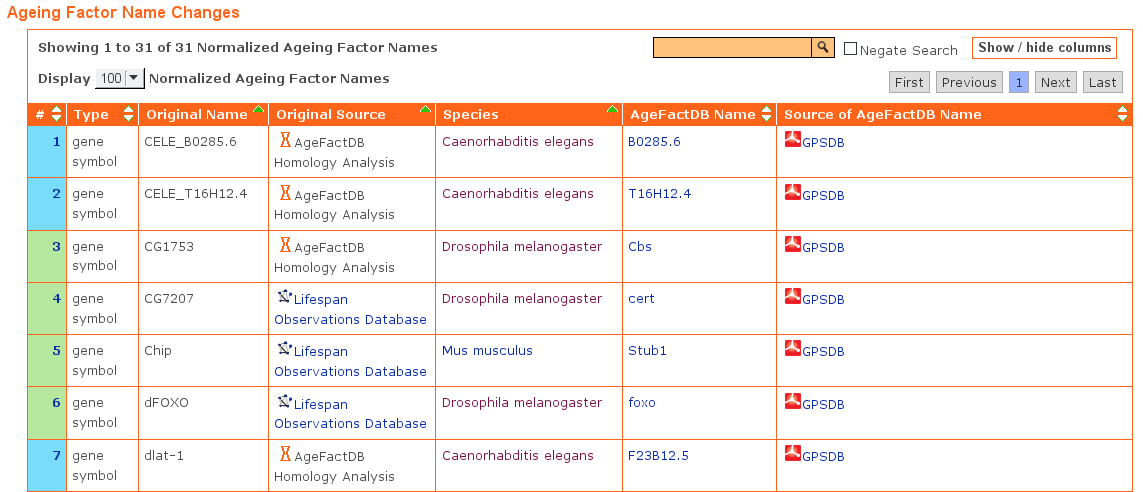
Unification
The same genes might have been integrated into two different source databases or even the same source database with different names.
It was tried to resolve this by using the gene/protein synonym database GPSDB and integrate the gene into AgeFactDB using the name marked as preferred name in GPSDB.
All name changes are listed in a table within the release page. A partial list of the ageing factor name changes as a result of the unification is shown below:
Network Data
The lifespan observation data from AgeFactDB was transformed into a network data representation.
Lifespan Observation/Ageing Factor Nodes
Each lifespan observation (LO) and each ageing factor (AF) is represented by a network node. Ageing factors involved in a specific lifespan observation are each linked to it by an edge. This facilitates to understand the often very complex system of observations involving overlapping sets of ageing factors at different conditions.
Annotation Nodes
Cruical annotation data is not just attached to an observation or ageing factor, visible for example while hovering a node. Instead it expands the network as annotation node (ANN).
AgeFactDB Annotation Nodes
JANet currently supports the following types of annotation nodes from AgeFactDB data:
- Allele Type (ALT)
- Citation (CIT)
- Species (SP)
Expert Knowledge Annotation Nodes
In addition to AgeFactDB-based annotation nodes, JANet also supports annotation nodes based on expert knowledge from other databases:
- Gene Ontology(GO)
- KEGG Metabolic Pathways (extracted from the BioSystems database)
Network Layout Algorithms
3D network visualization requires to define a position in the three-dimensional space for each node, called a network layout. Spring-force algorithms provide often useful layouts. In these algorithms connected nodes attract each other and unconnected nodes repel each other. The attracting and repelling forces are calculated like for spring forces in physics. As a start, the nodes are usually placed on random positions. The forces are then calculated for each node pair in an iterative process to define new node positions, until an equilibrium is reached or a fixed number of iterations.
Fruchterman-Reingold
JANet uses the Fruchterman-Reingold algorithm in an adapted version for 3D layout, implemented in the Jmol scripting language. It generates good layouts for small to medium sized networks, up to a few hundred nodes.
FMMM - Fast Multipole Multilevel Method
For larger networks the FMMM (Fast Multipole Multilevel Method) algorithm used in BioLayout Express 3D, another 3D network viewer, provides better layouts than the Fruchterman-Reingold algorithm. It is not implemented in JANet yet, but JANet provides export/import options that enable to use BioLayout Express 3D as an external layout generation tool for larger networks.
Visualization Techniques
JANet provides several visualization techniques for lifespan observation (LO) networks of ageing factors (AFs).
Node color and size are used there to speed-up the lookup of node properties by visual perception for all nodes at once. Generally these properties are the node type and the qualitative and quantitative lifespan change.
The edge color is usually inherited from the node of a pair whose color carries specific information for the other node. For AF/LO edges this is the LO node, whose color usually indicates the direction of the lifespan change (increased, decreasd, none).
Direct Neighbourhood
The direct neighbourhood network provides a compact view of the effects of all LOs in which an AF is involved directly.
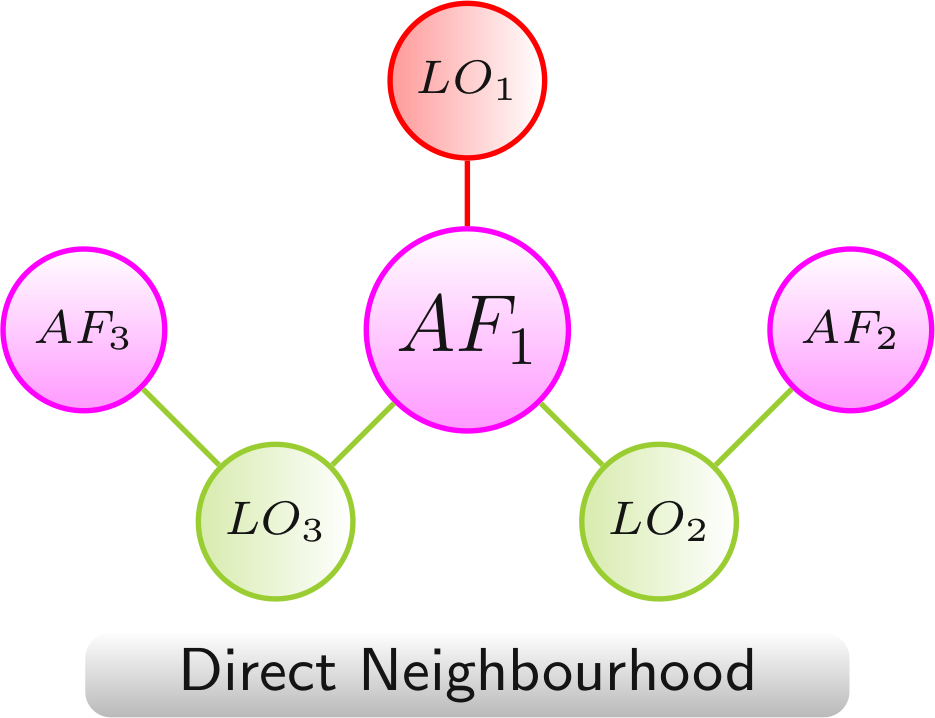
Color scheme: AF, LO - increased lifespan, LO - decreased lifespan
Complete Neighbourhood
The complete neighbourhood network provides an overview on all experimentally analyzed AF combinations and their effects on lifespan, originating from the AF in the focus.
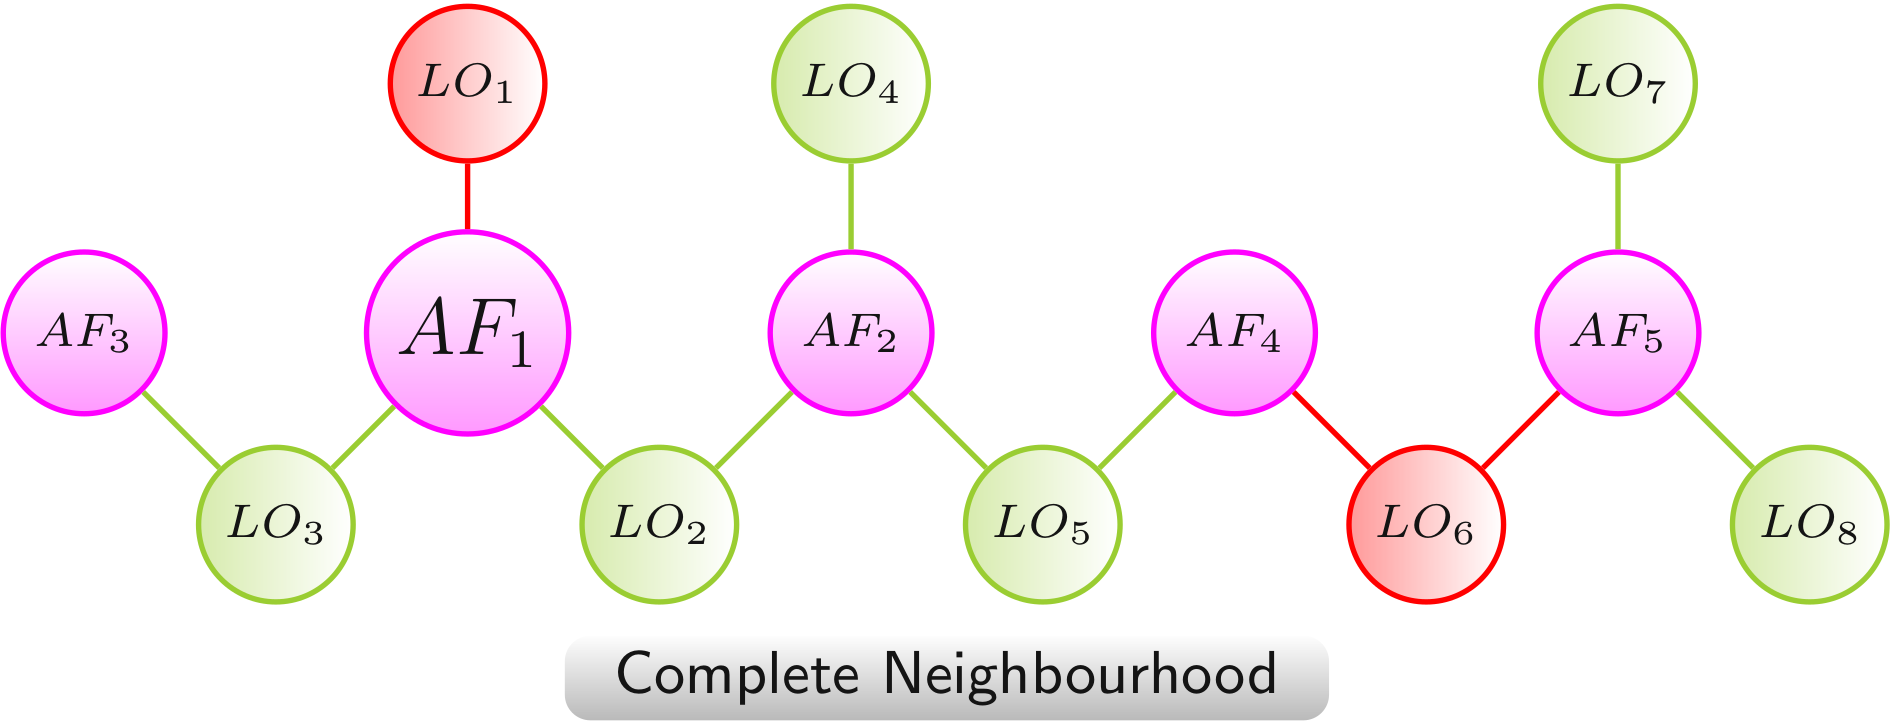
Color scheme: AF, LO - increased lifespan, LO - decreased lifespan
Augmentation via Annotation Nodes
The augmented network provides additional information on either the AFs or the LOs or both by the integration as additional annotation nodes. This provides a quicker access to the additional information and leads to a semantic clustering of the AFs and LOs.
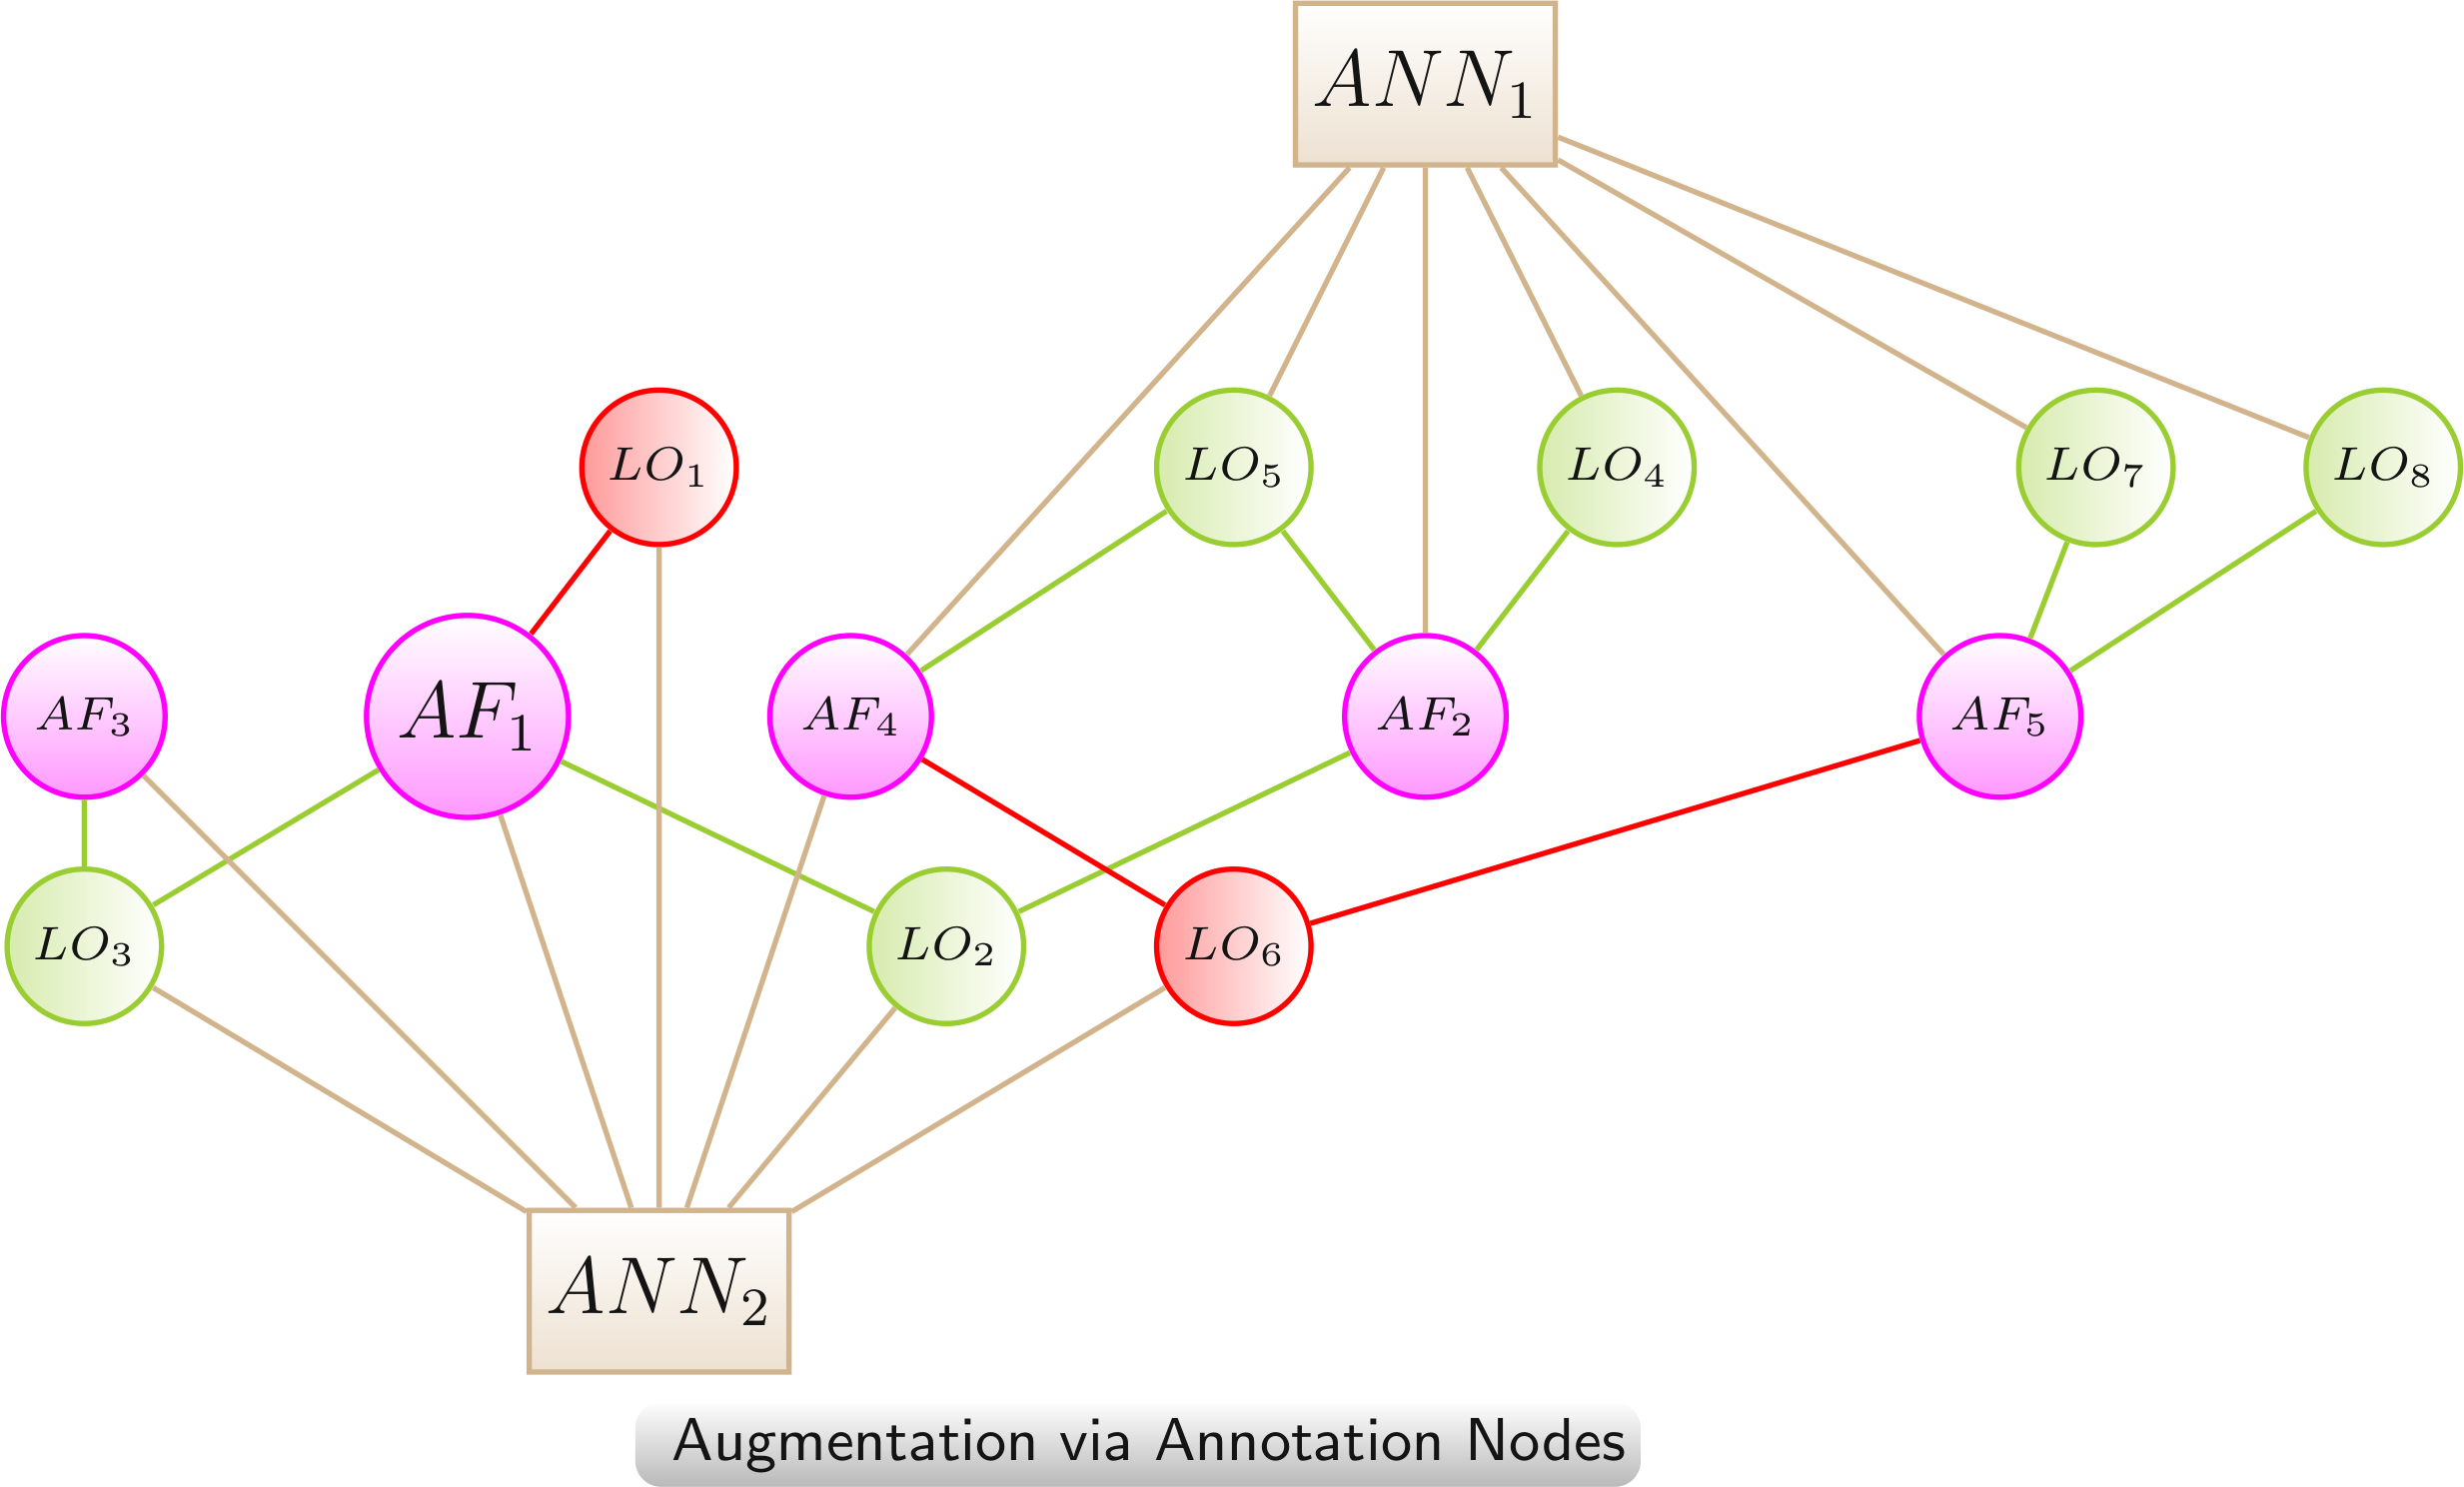
Color scheme: AF, LO - increased lifespan, LO - decreased lifespan, annotation
Data Transfer betwen Nodes
The data transfer between nodes is especially useful for reducing the complexity of a network by removing the nodes from which data was transferred. The transfer enables to retain some information from the removed nodes.
Color scheme: annotation, AF - linked only to LOs with increased lifespan,, AF - linked to LOs with highly mixed lifespan changes (increased and decreased > 20%)
Multispecies Technique
In contrast to genes, chemical compounds and other AFs can be linked to LOs of multiple species. This requires to augment such networks by species nodes (SP) that are linked to the corresponding LOs. The links between the AFs and the species nodes were left out. This will result in a much clearer and less complex network view, grouping the network clearly according to the involved organisms.
Because of the importance of the species information in these networks and the additional restriction to one type of species links a separate technique was defined.
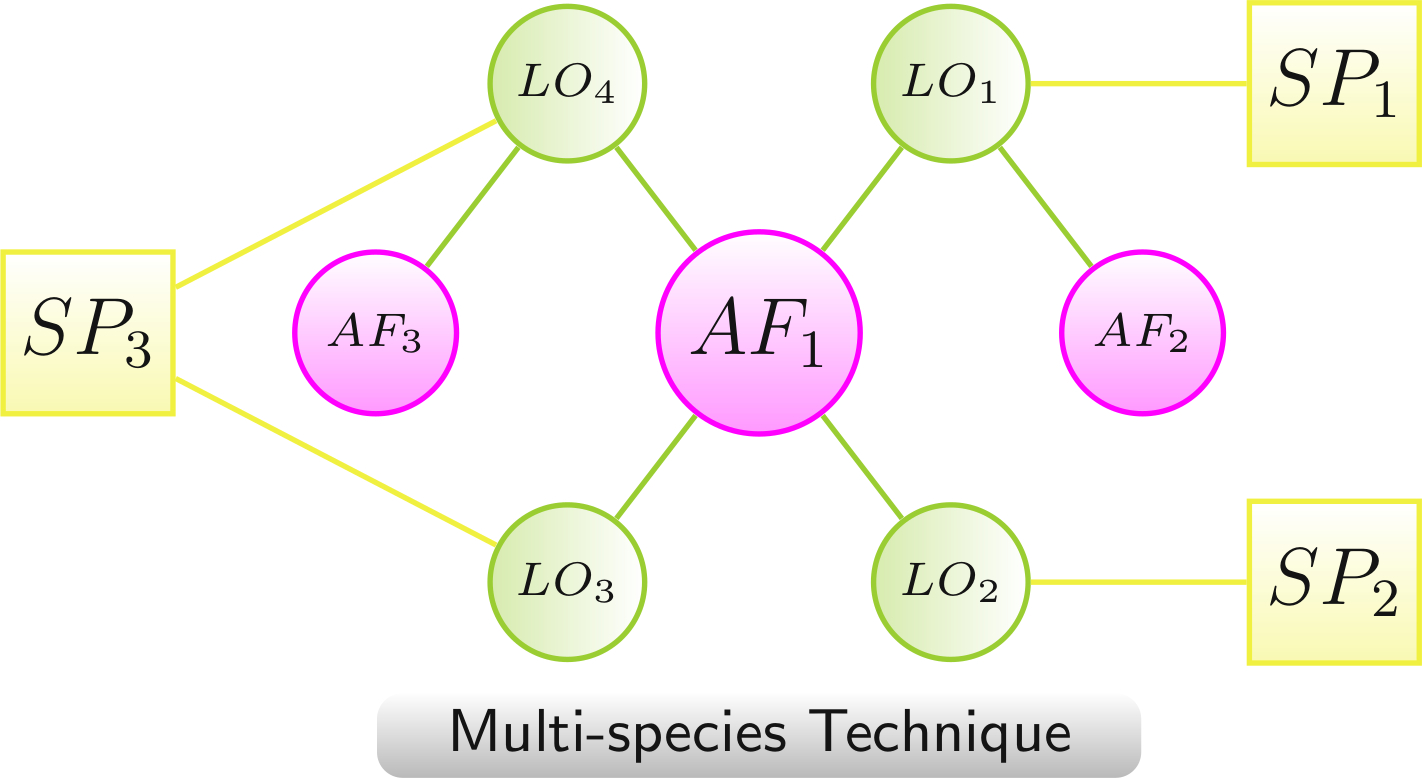
- AF1 to SP1 via LO1, to SP2 via LO2, and to SP3 via LO3 and LO4
- AF2 to SP1 via LO1
- AF3 to SP3 via LO4
Color scheme: AF, LO - increased lifespan, LO - decreased lifespan, species
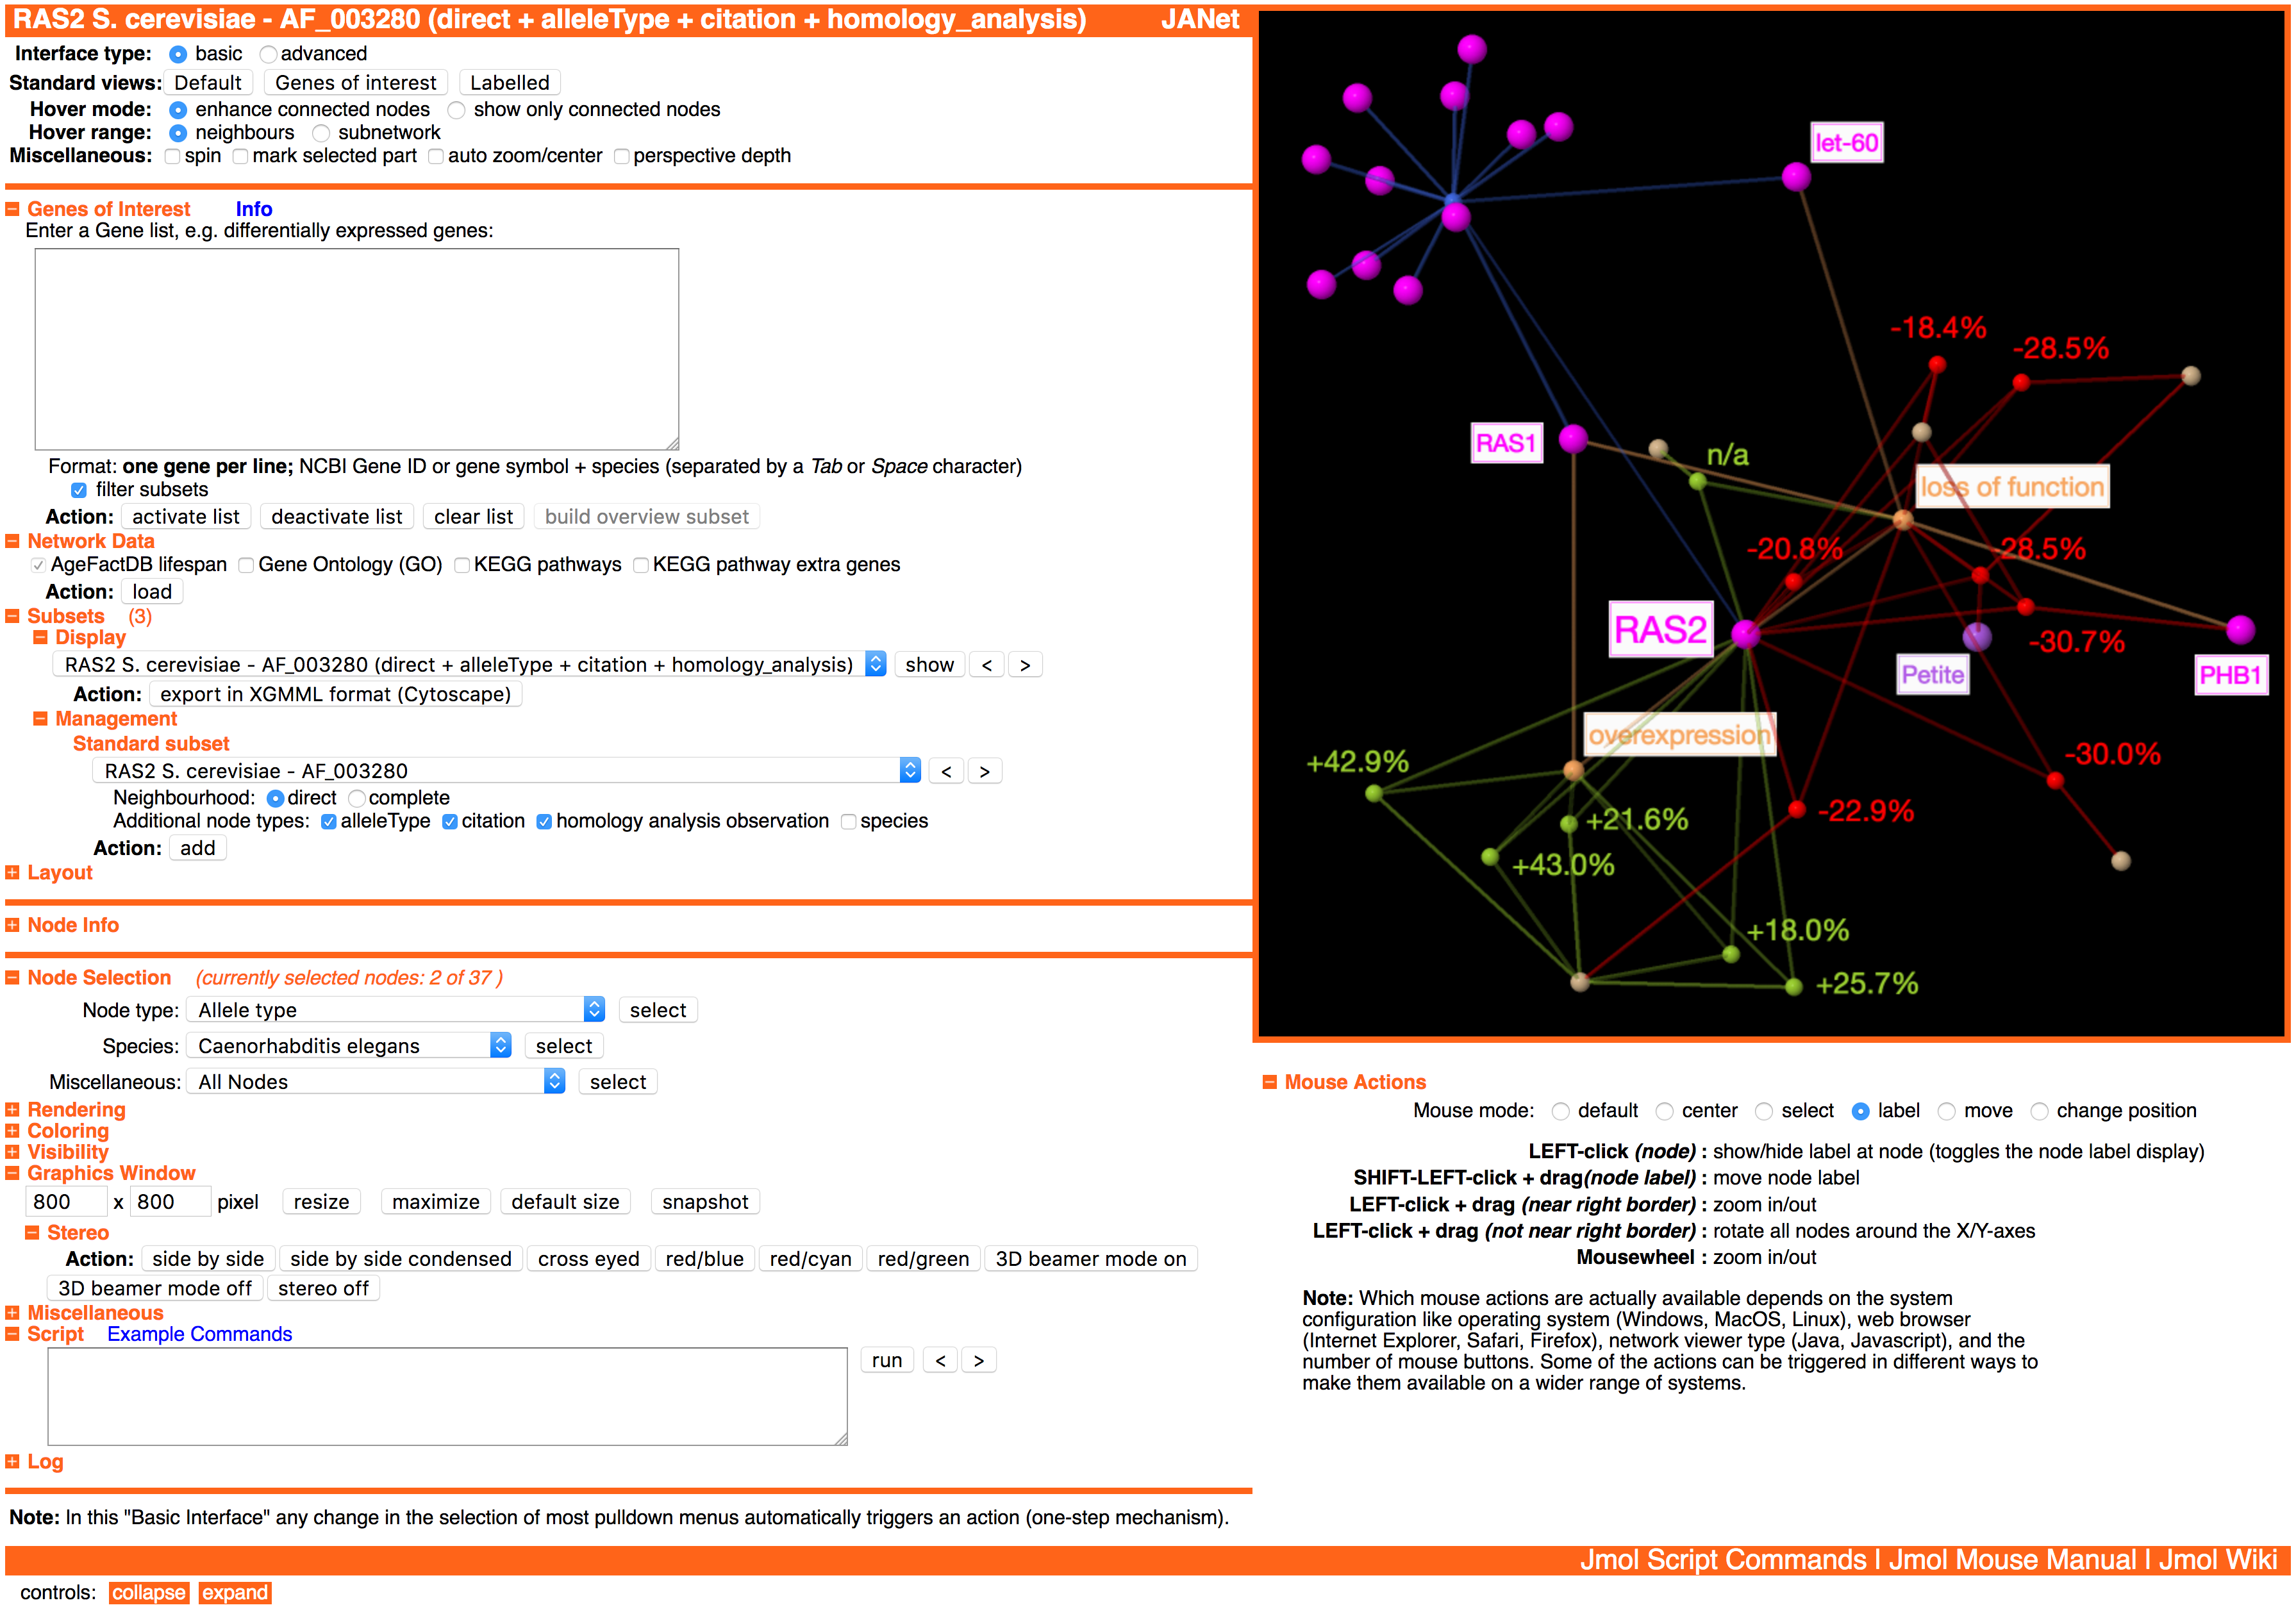
JANet Web Browser Interface
Overview
JANet has a web browser interface with two major components: the Jmol/JSmol graphics window and the control elements surrounding it.
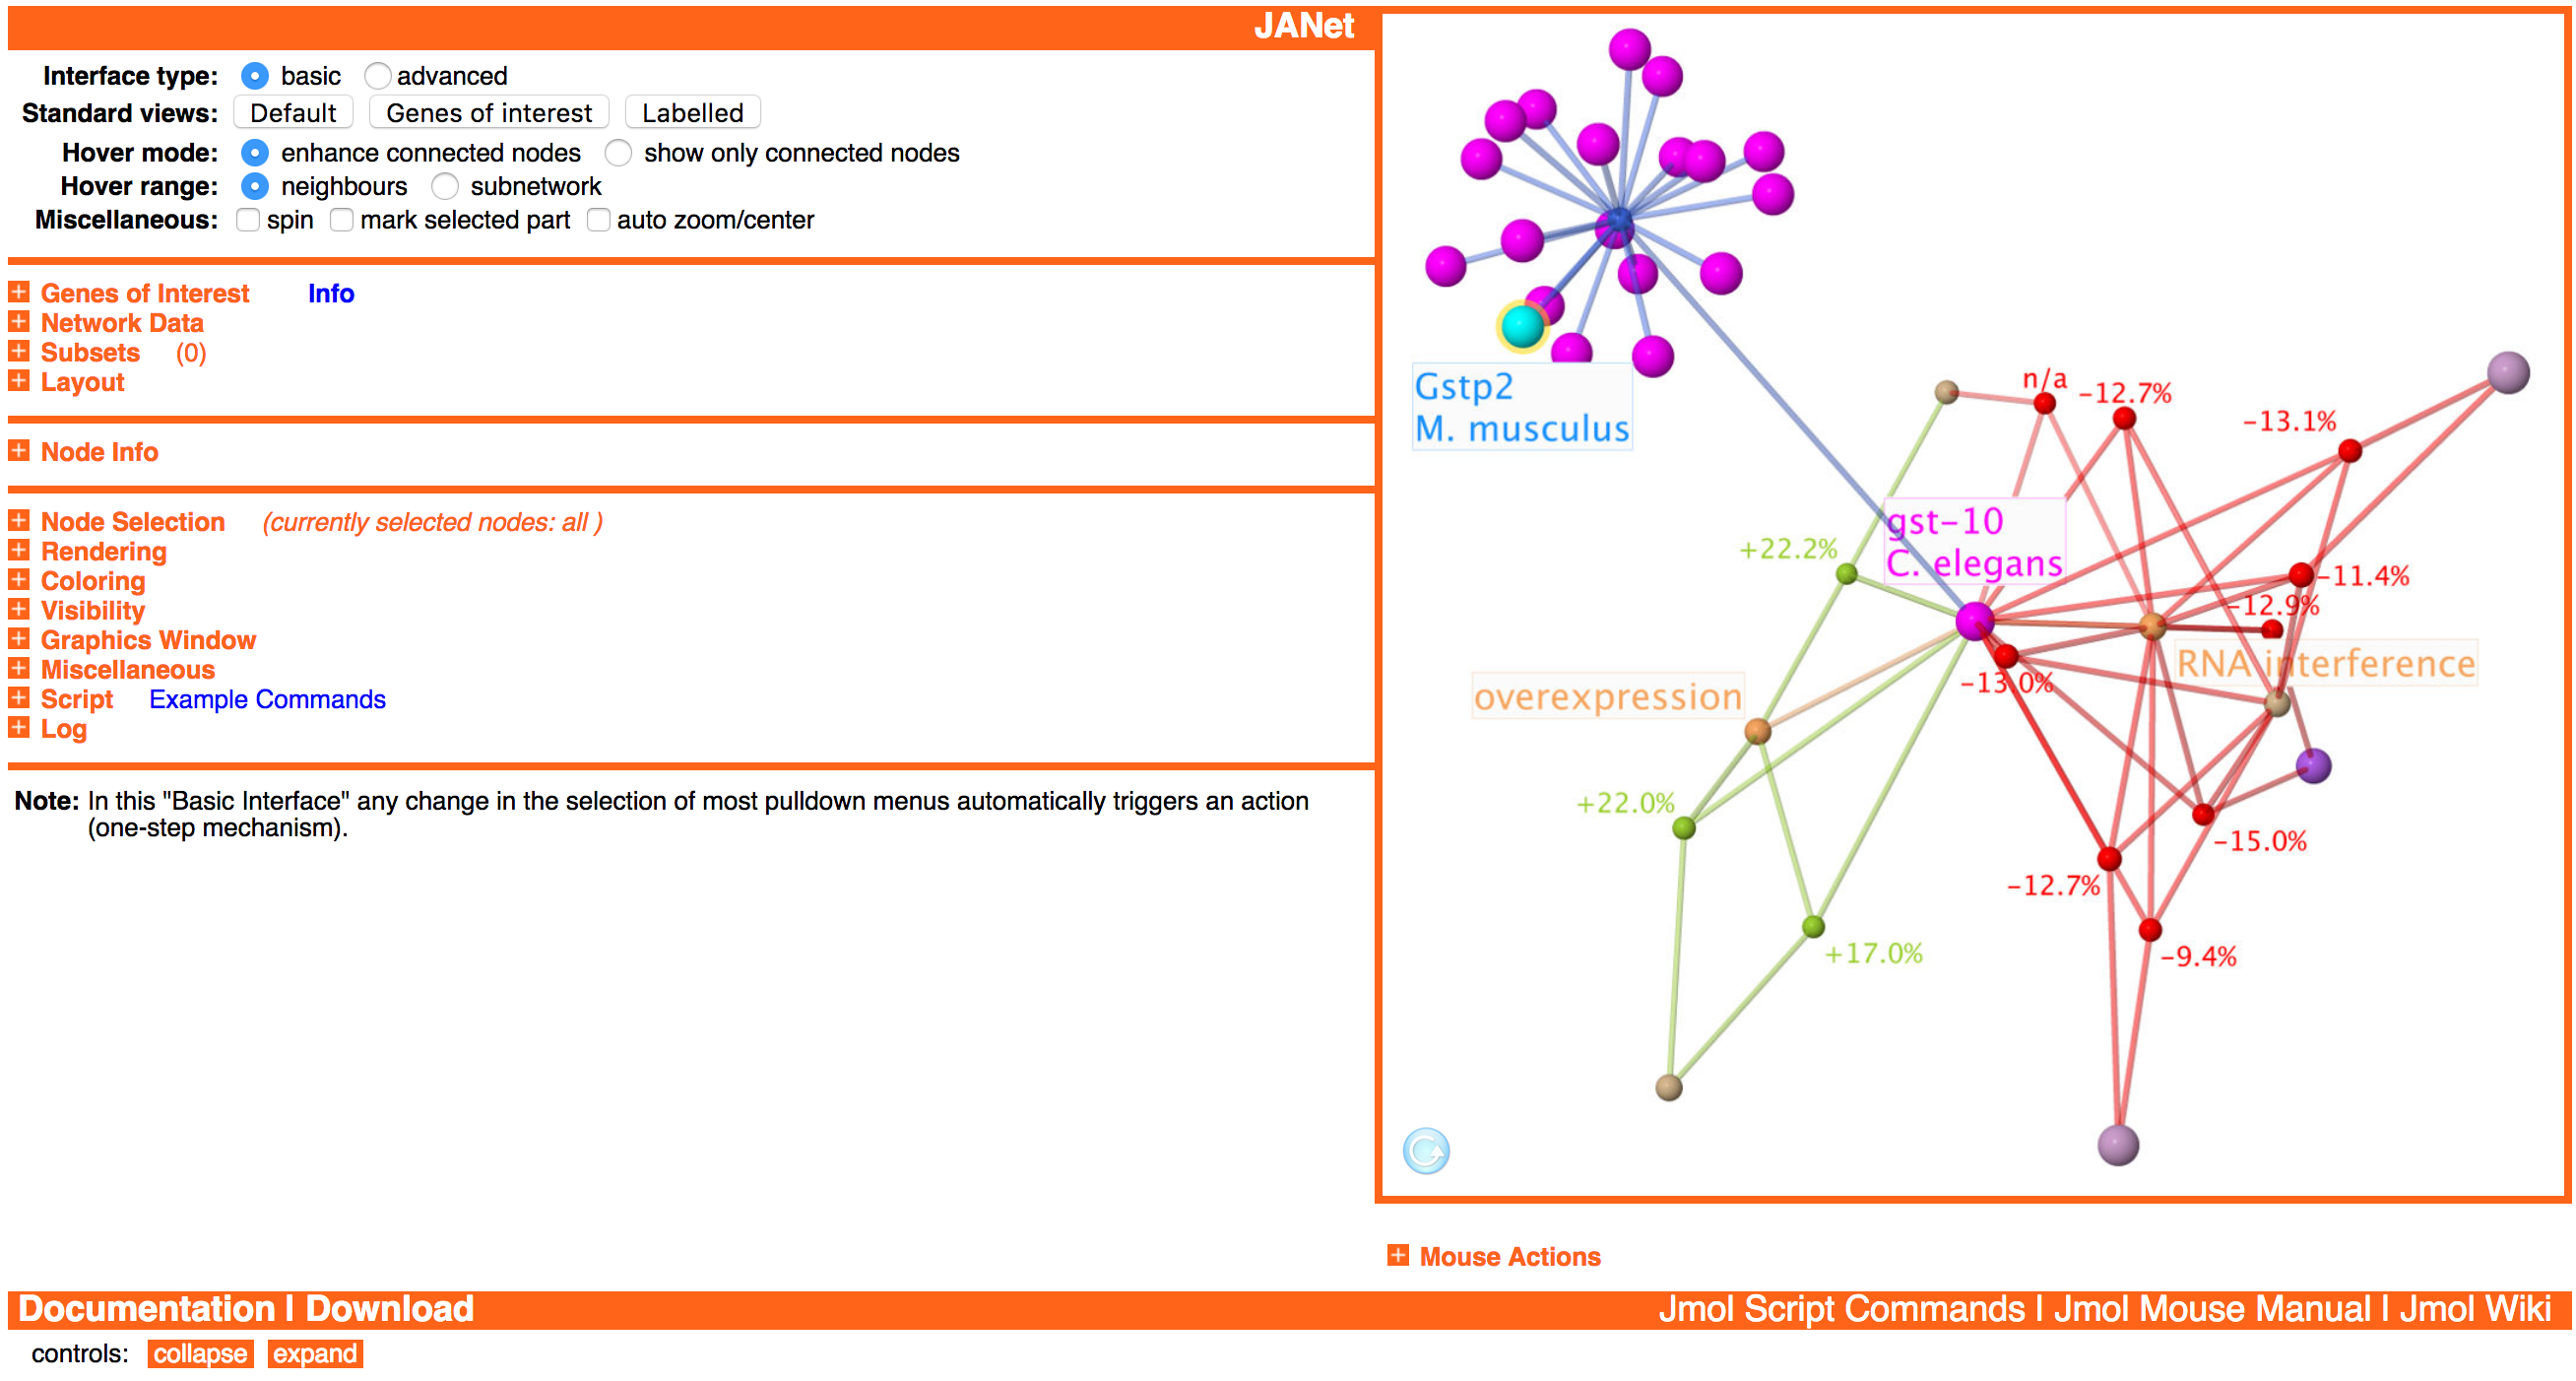
After loading JANet, the graphics window is not activated yet, indicated by the arrow on a blue background at the bottom left of the graphics window. This enables to customize JANet first and change for example the network data set, loaded automatically after the activation. The graphics window gets activated either manually (by clicking at it) or by using control elements that require the graphics window.
Basic Principles
Network Data Organization
As default network data all ageing factors/putative ageing factors, all lifespan observations, all homology analysis observations, and their connections are loaded. In addition, GO (Gene Ontology) term and KEGG pathway nodes and their connections to ageing factors can be loaded.
The loaded network data can be filtered to build so-called subsets. A subset is an independant network with an individual layout and visual representation.
Most actions are working only on the currently displayed subset. Exceptions are for example the genes of interest analysis and the subset generation.
Action on Selection
Generally, actions like node coloring and rendering work only on the currently selected nodes of the currently displayed subset. This enables to change node properties individually to create custom views.
Basic and Advanced Interface
The user can switch at any time between two interface types:
The default basic interface provides the basic functionality. It is designed to reduce the manual work by several automatisms and to reduce the complexity of the interface. The advanced interface offers additional options and provides more flexibility by reducing automatisms.
A) Basic Interface
B) Advanced Interface
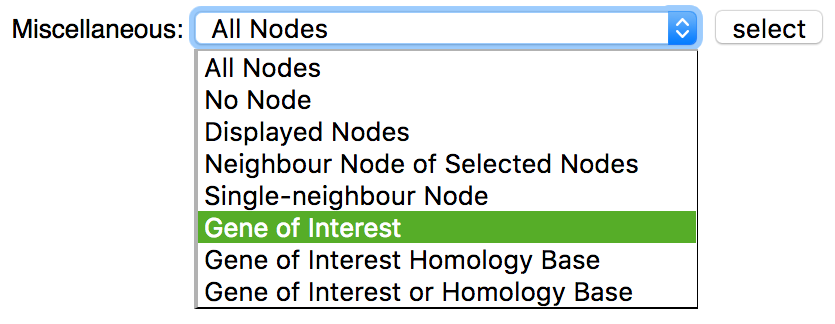
A) In the basic interface there are available three separate selection menus (Node type, Species, Miscellaneous). As soon as a value is selected in one of these menus, the corresponding nodes are selected and all other nodes are deselected (one-step mechanism). For each selection menu there is also a button (select) for starting the selection if the desired value was already selected earlier.
B) In the advanced interface there are available two additional selection criteria (Property value, Degree) and five buttons (only, +, -, &, not) for each criterium instead of one. After selecting a value in one of the menus or typing a value, nothing will happen yet. Additionally, it is required to press one of the five corresponding buttons to start the selection process (two-step mechanism). This separation of value selection and actual node selection, together with the boolean operations provided by the new buttons, enables to build complex selection rules.
Treeviewer-like Structure
The options are arranged in a treeviewer-like structure. Subsections can be expanded/collapsed by clicking at the / pictograms or the subsection titles. This enables to keep the large number of control elements more compact, adapted to the current needs of the user.
At the bottom left of the interface there are two buttons (collapse all, expand all) to collapse and exand all subsections at once.
Main Sections
The control elements are organized into five main sections, separated by horizontal lines.
General Options
In the section at the top left there are options for changing the general viewer behaviour and for creating standard views:
The bar at the top contains the name of the current subset at the left side. And the viewer name JANet at the right side is a link to the start page.
Data Organization and Analysis
In the second section there are controls for loading network data, handling subsets, building network layouts, and analyzing user-provided genes of interest:
Subset-specific Controls
The third section is intended for susbset-specific controls and information. Currently only the node info obtained after left-clicking at a node in the mouse mode default is included here:
 Node Info
| ageingFactorId: | AF_005765 |
|---|---|
| ageingFactorName: | daf-2 |
| ageingFactorType: | gene |
| baseEntryStableIds: | AF_005765; AF_007543 |
| homologyAnalysisStatus: | not added |
| infoKey: | ageingFactorId |
| labelCustom: | Gene: daf-2, Caenorhabditis elegans; (AF_005765) |
| labelLong: | Gene: daf-2, C. elegans; (AF_005765, #4619) |
| labelShort: | daf-2 |
| lifespanDataAvailable: | true |
| ncbiGeneId: | 175410 |
| nodeId: | AF_005765 |
| nodeKey: | ageingFactorId||AF_005765 |
| nodeNumber: | 4619 |
| nodeSubType: | gene |
| nodeSubTypeId: | AF_GEN |
| nodeType: | ageingFactor |
| nodeTypeId: | F |
| species: | Caenorhabditis elegans |
| speciesShortcut: | C. elegans |
| subTypeInfoKey: | ageingFactorType |
| subTypeInfoKeys: | ageingFactorType |
| subnetworkNumber: | 1 |
| temperature: | 0 |
| x: | 113.81852 |
| y: | 87.25108 |
| z: | 157.26854 |
Other subset-specific stuff might be added here in future versions of JANet.
Subset-unspecific Controls
The last section at the left side contains subset-unspecific controls for manipulating individual nodes and edges, controlling graphics window properties, scripting, and logging:
 Node Selection(currently selected nodes: 135 of 9560 )
Rendering
Coloring
Visibility
Graphics Window
Miscellaneous
ScriptExample Commands
Log
Mouse Action Controls
Below the graphics window there are the mouse action controls for switching between different mouse modes and submodes:
They enable to change the actions of the mouse pointer on different mouse events like clicking and dragging, also in combination with modifier keys (shift, command, control, alt).
The section also contains an overview on the available mouse actions for the current mouse mode:
Unfortunately, it depends on the system configuration like operating system (Windows, MacOS, Linux), web browser (Internet Explorer, Safari, Firefox), network viewer type (Java, Javascript), and the number of mouse buttons, which actions are actually available. Some of the actions can be triggered in different ways to make them available on a wider range of systems.
Standard Views
JANet provides several standard views, designed for specific purposes. They don't set all properties of a view, only the basic ones like node/edge color, size, and labelling.
Standard View - Default
The standard view Default is designed for larger networks and is applied for example to the default subset containing 9560 nodes and 11535 edges. It sets the following properties:
- Nodes are colored according to the node type and subtype. This includes that lifespan observation nodes and their edges are colored according to the qualitative lifespan change.
- Lifespan observation nodes are sized proportionally to the quantitative lifespan change. Other nodes are sized according to the node type.
- Node labels are all switched off.
- Edges are colored translucent.
Standard View - Genes of Interest
The standard view Genes of interest is designed for the analysis of user-provided genes of interest. It consists actually of two slightly different views: one for the large overview network and one for direct/complete neighbourhood networks. They are selected automatically and set the following common properties:
- Genes of interest are colored cyan, the other nodes are colored according to the node type and subtype. This includes that lifespan observation nodes and their edges are colored according to the qualitative lifespan change.
- Genes of interest and matching ageing factors are labelled with their name.
- Nodes are sized according to the node type.
- Edges are colored translucent.
Since the overview network is potentially much larger, the amount of labels is reduced:
- Overview network
- Matched ageing factors and genes of interest with lifespan observations are labelled with their name.
- Direct/complete neighbourhood networks
- All genes of interest and matched ageing factors with lifespan observations are labelled with their name.
- Lifespan observation nodes are labelled with the quantitative lifespan change (label background color switched off).
- Lifespan observation nodes without a lifespan change value are marked by a halo and labelled with n/a (not available).
- Allele type nodes (not included in the overview network) are labelled by their name (label background color switched on).
Standard View - Labelled
The standard view Labelled is designed for smaller networks, for example the direct neighbourhood network of ageing factors. It sets the following properties:
- Nodes are colored accrding to the node type and subtype. This includes that lifespan observation nodes and teir edges are colored according to the qualitative lifespan change.
- Lifespan observation nodes are sized proportionally to the quantitative lifespan change. Other nodes are sized according to the node type.
- Lifespan observation nodes are labelled with the quantitative lifespan change (label background color switched off).
- Lifespan observation nodes without a lifespan change value are marked by a halo and labelled with n/a (not available).
- The ageing factor in the focus is labelled with its name (label background color switched on).
- Allele type nodes are labelled with their name (label background color switched on).
- Edges are colored translucent.
Genes of Interest Analysis
Users can provide a list of genes to check it for matches in AgeFactDB.
After starting the analysis, the immediate result will be a table containing matching genes from AgeFactDB. This can be matches to ageing factors or putative ageing factors.
Additionally, the results can be visualized by building an overview subset containing all matches. Since it might take some time, it is not created automatically.
For each matched gene there can also be build a standard subset containing the direct or complete neighbourhood. To simplify finding the matched genes in the dropdown list, a filter can be activated to include only matches in the list:
If the analysis was already started before, the filter is activated/deactivated immediately. Otherwise the filtering is done later.
Gene List
The gene list can be for example a list of differentially expressed genes obtained from ageing-related experiments.
Genes of Interest Info
Format: one gene per line; NCBI Gene ID or gene symbol + species (separated by a Tab or Space character)
For each gene there must be provided either the gene symbol and species name, separated by a TAB or Space character (e.g.: Car4 Mus musculus), or the NCBI Gene database ID (e.g.: 13799). And there must be only a single gene per line.
The NCBI Gene ID should be preferred because it is unambigous, although the NCBI Gene ID is not available for some of the ageing factors. Gene symbol/species combinations on the other hand can be ambiguous and a match might be missed because different synonyms are used. It is also possible to provide both variants, in separate lines.
Analysis Start
The analysis is started by clicking the activate list button:
The build overview subset button will then also become active. The deactivate list function is not implemented yet. But a similar effect can be achieved by activating an empty list (click the clear list button first ad then the activate list button).
Result Table
The immediate result is a match info table like the following example table:
| Gene of Interest | AgeFactDB | |||||||
|---|---|---|---|---|---|---|---|---|
| No. | Gene Symbol | Species | NCBI Gene ID | Stable ID | Gene Symbol | Species | NCBI Gene ID | Ageing Relevance Evidence |
| 1 | 180821 | AF_007026 | bus-8 | Caenorhabditis elegans | 180821 | experimental evidence | ||
| 2 | BE10.2 | Caenorhabditis elegans | AF_004033 | BE10.2 | Caenorhabditis elegans | 176695 | experimental evidence | |
| 3 | C14A4.9 | Caenorhabditis elegans | AF_004304 | C14A4.9 | Caenorhabditis elegans | 174637 | experimental evidence | |
| 4 | Cds1 | Mus musculus | AF_004800 | Cds1 | Mus musculus | 74596 | homology analysis; based on gene C33H5.18 Caenorhabditis elegans (NCBI Gene ID 3565046, AF_004430) | |
| 5 | Cyp3a16 | Mus musculus | AF_010382 | Cyp3a16 | Mus musculus | 13114 | homology analysis; based on gene cyp-13B1 Caenorhabditis elegans (NCBI Gene ID 181462, AF_005126) | |
| 6 | Cyp3a41a | Mus musculus | AF_010364 | Cyp3a41a | Mus musculus | 53973 | homology analysis; based on gene cyp-13B1 Caenorhabditis elegans (NCBI Gene ID 181462, AF_005126) | |
| 7 | Cyp3a44 | Mus musculus | AF_010369 | Cyp3a44 | Mus musculus | 337924 | homology analysis; based on gene cyp-13B1 Caenorhabditis elegans (NCBI Gene ID 181462, AF_005126) | |
| 8 | col-131 | Caenorhabditis elegans | AF_006385 | col-131 | Caenorhabditis elegans | 178254 | homology analysis; based on gene col-93 Caenorhabditis elegans (NCBI Gene ID 259335, AF_007082) | |
| 9 | col-14 | Caenorhabditis elegans | AF_004505 | col-14 | Caenorhabditis elegans | 177559 | homology analysis; based on gene col-93 Caenorhabditis elegans (NCBI Gene ID 259335, AF_007082) | |
| 10 | col-165 | Caenorhabditis elegans | AF_006505 | col-165 | Caenorhabditis elegans | 180710 | homology analysis; based on gene col-93 Caenorhabditis elegans (NCBI Gene ID 259335, AF_007082) | |
The left part Gene of Interest shows the matching input genes.
The right part AgeFactDB shows the corresponding ageing factors and putative ageing factors. The Ageing Relevance Evidence column contains information about the available evidences:
- experimental evidence means that the matching gene is an ageing factor with experimental ageing relevance evidence.
- homology analysis means that the matching gene is a putative ageing factor. The ageing factors that are the basis for the homology analysis result (called Homology Base within JANet) are also included.
All genes from the match info table can be selected by using the Miscellaneous dropdown menu in the Selection subsection:
Result Visualization
Overview Subset
By clicking the build overview subset button shown above, a new overview subset is generated for the visualization of the results. Depending on the number of matching genes and the resulting size of the network, the generation can take quite some time, especially in the Javascript variant of JANet.
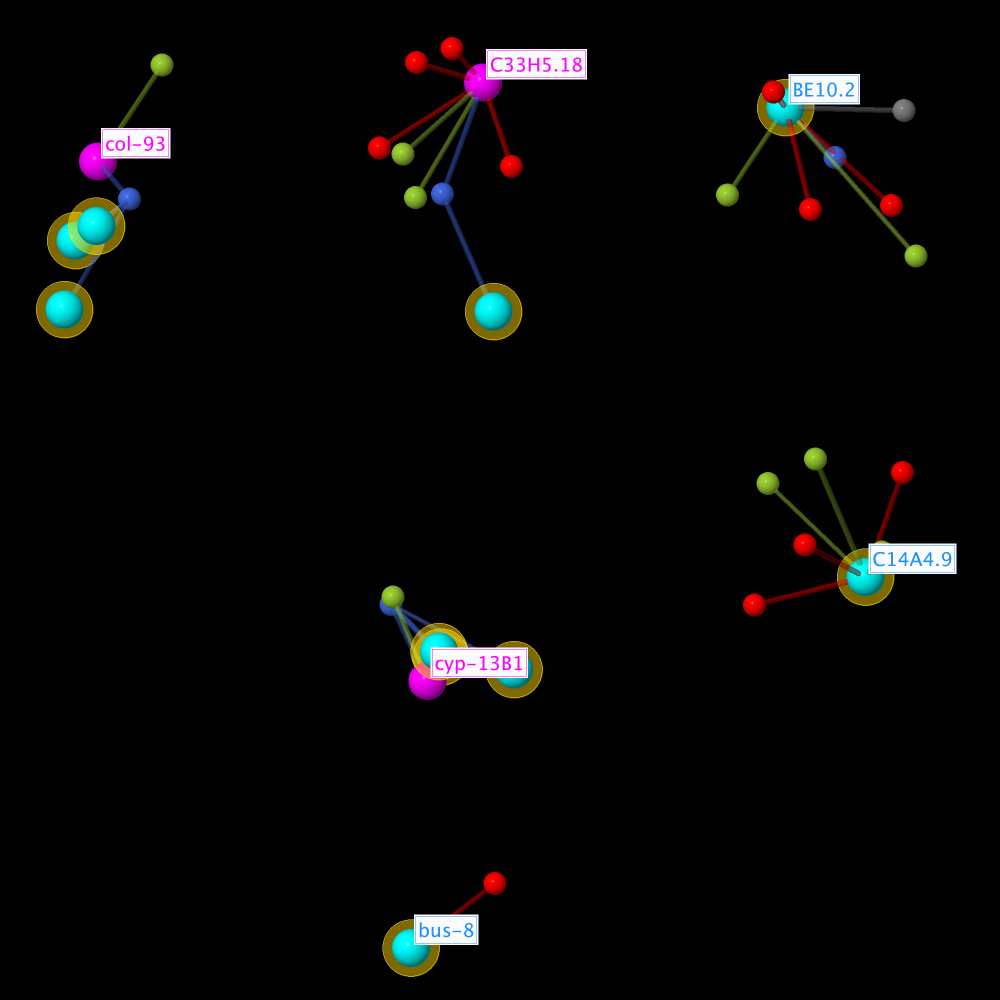
The subset contains all matching genes of interest, all homology base ageing factors, their direct neighbourhood lifespan observations, and their homology analysis observations. All genes of interest are marked by a yellow halo.
Since the subset can become quite large, other ageing factors from the direct neighbourhood networks and other putative ageing factors from the homology analysis observations are not included. And in order to reduce the number of node labels, only ageing factors are labelled and no putative ageing factors.
Allele types are not included in order to keep separate subnetworks for a tiled view.
Color scheme:
Detailed Subsets
For each gene of interest there can also be build more detailed direct and complete neighbourhood lifespan observation networks. It will not make much sense to generate direct neighbourhood subsets from putative ageing factors, because they will only contain the homology group.
If the subset filter (described above) is activated, it will be easier to pick matching genes from the dropdown list in the subset management subsection.
A special standard view Genes of interest (see section Standard Views above) is available. It can be applied after the generation of the subset, if desired.
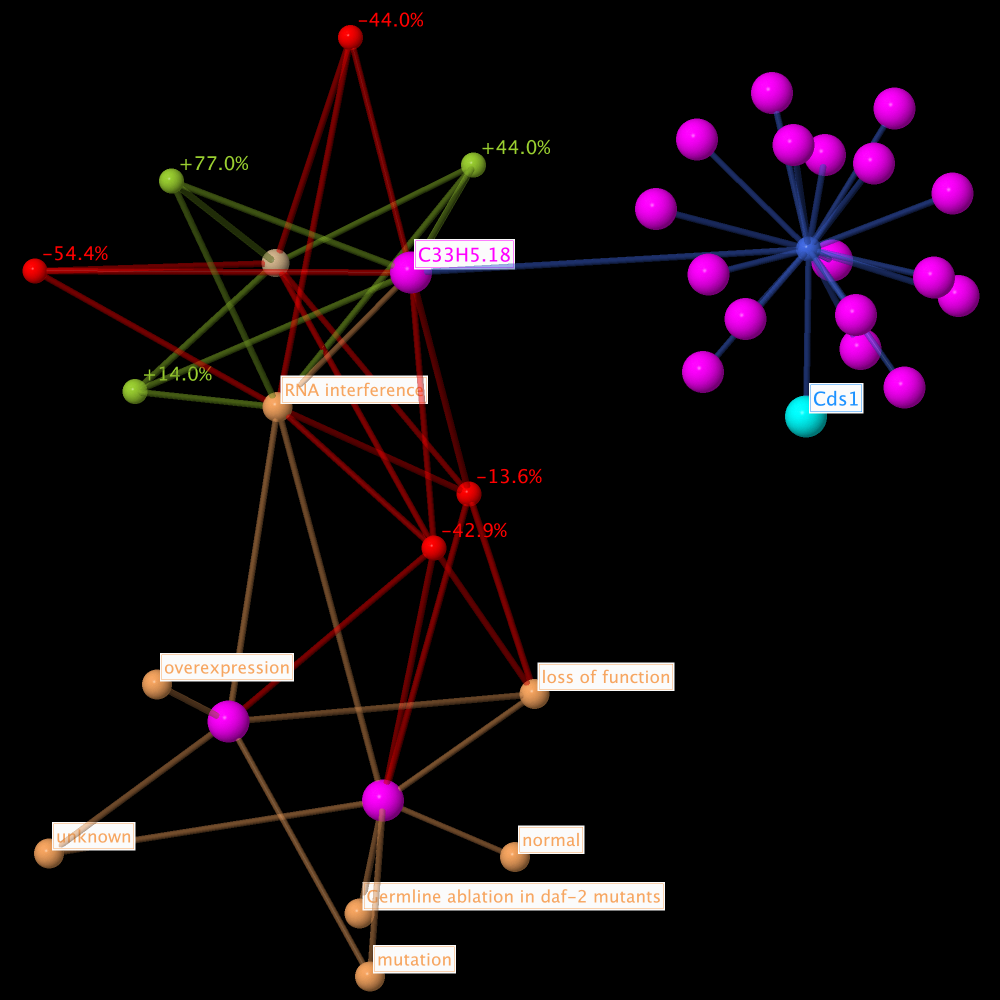
The subset contains the direct neighbourhood network of the homology base ageing factor C33H5.18, matching the gene of interest and putative ageing factor Cds1 from M. musculus. Included are the additional node types allele type, citation, and homology analysis observation.
The standard view Genes of interest (see section Standard Views above) was applied after the subset generation. Therefore the gene of interest Cds1 from M. musculus and the homology base ageing factor C33H5.18 are labelled, also the lifespan observations and allele types. And the gene of interest is colored lightblue.
Color scheme: